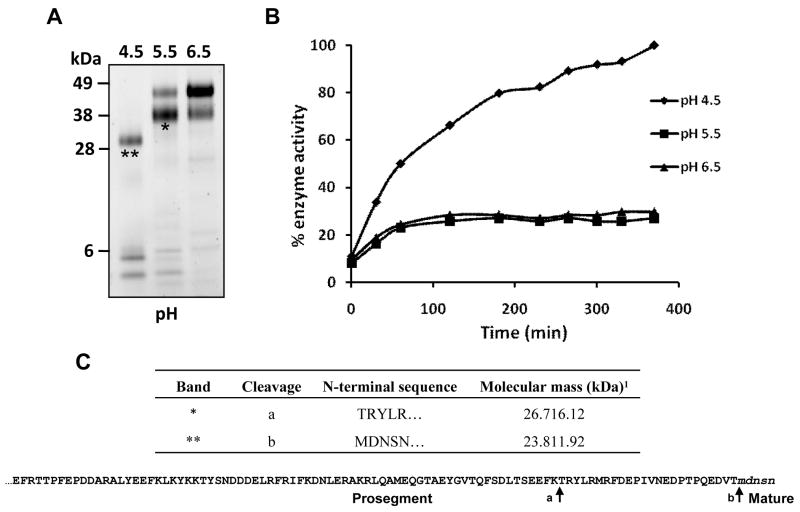
Figure 1.
Auto-activation of Ov-CF-1 at pH 4.5. (A) Purified recombinant Ov-CF-1 (50 μg) was incubated in either 0.1 M sodium acetate (pH 4.5 or 5.5) or 0.1 M sodium phosphate (pH 6.5) for 6 h. Aliquots of the reaction mixtures were removed after 6 h, the hydrolysis stopped by addition of E-64 on ice, and analyzed on 4-12 % Bis-Tris NuPage gels (Invitrogen). At pH 6.5, Ov-CF-1 migrated as a major band of 47 kDa representing the unprocessed zymogen (Pinlaor et al., 2009). Following incubation at pH 5.5, the majority of the enzyme migrated as an intermediate band with a molecular mass of 41 kDa. At pH 4.5, Ov-CF-1 had been fully processed and migrated as a single band at 30 kDa with low molecular mass prosegment peptides (< 6 kDa) clearly visible. (B) The Ov-CF-1 auto-activation reactions shown in (A) were assayed for peptidolytic activity against the fluorogenic dipeptide substrate Z-Leu-Arg-NHMec (measured by monitoring the release of the fluorogenic leaving group (-NHMec) over 360 min (6 h) at 37°C. (C) N-terminal sequences obtained for the Ov-CF-1 samples marked with asterisks in (A). The cleavage sites (arrows) identified by N-terminal sequencing are also mapped onto the primary amino acid sequence of the Ov-CF-1 prosegment (bottom). The EF found at the N-terminal was introduced by the EcoRI cloning site used in the pPIC ZαA expression vector. 1Theoretical molecular mass of the Ov-CF-1 polypeptides calculated by Compute pI/MW.

