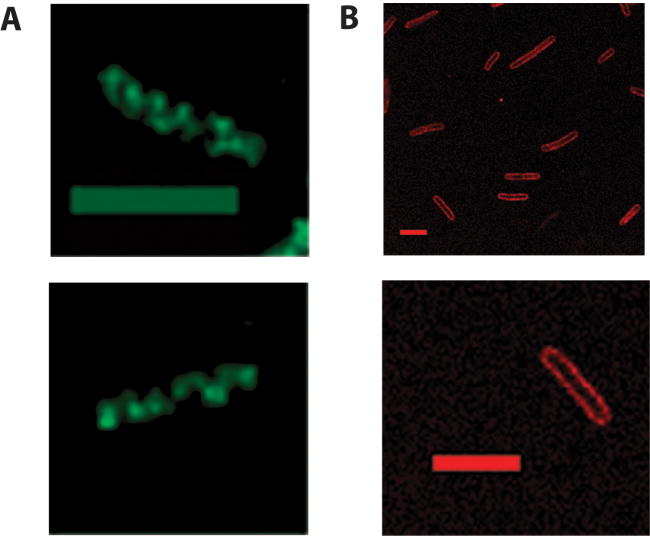
Figure 4.
(A) Immunofluorescent images of wild-type W3110 cells cultured in LB medium prior fixation and treatment with affinity-purified DnaA antibody and goat-anti-rabbit FITC conjugated secondary antibody. Images of cells are maximum image projections of 0.2 micron stacks taken on Olympus confocal microscope and deconvolved using Metamorph nearest neighbor software. Calibration bar equals 2 microns. (B) Immunofluorescent images of YYH605 cells treated with anti-leader peptidase antiseum and TRITC conjugated secondary antibody. Calibration bar equals 5 microns.

