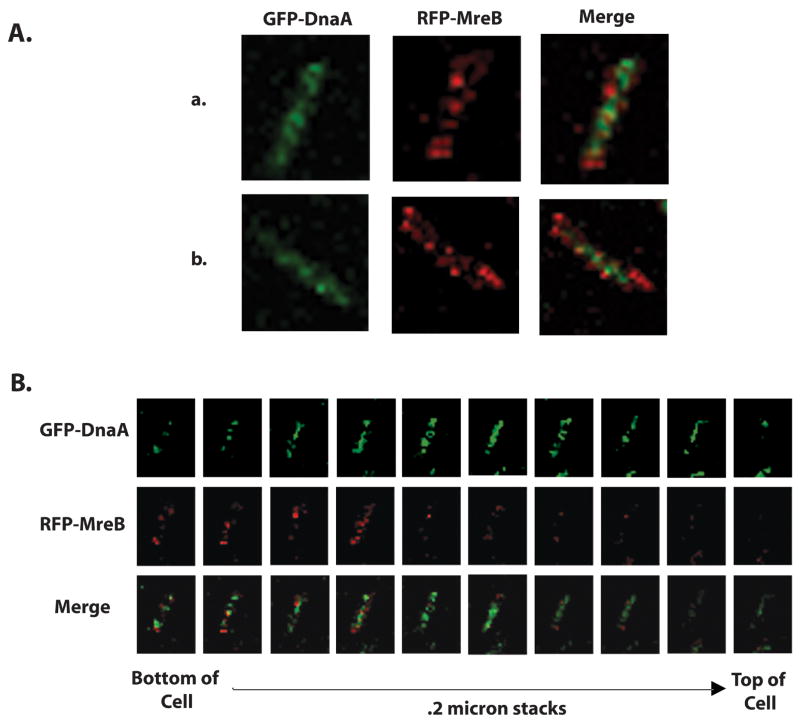
Figure 5.
(A) LBK2 cells (YYH605 mreB-rfpsw yhdE::cat) expressing GFP-tagged DnaA and RFP-tagged MreB were grown in M9 + succinate medium to an OD600 of 0.3 and then imaged sequentially through 0.2 micron z-stack slices for GFP and RFP by confocal fluorescence microscopy. Maximum image projections of GFP-DnaA, RFP-MreB and merged images are shown for two representative cells (a and b). (B) Individual 0.2 micron z-stack slices from cell “a” (above) are shown for GFP-DnaA, RFP-MreB, and merged images.

