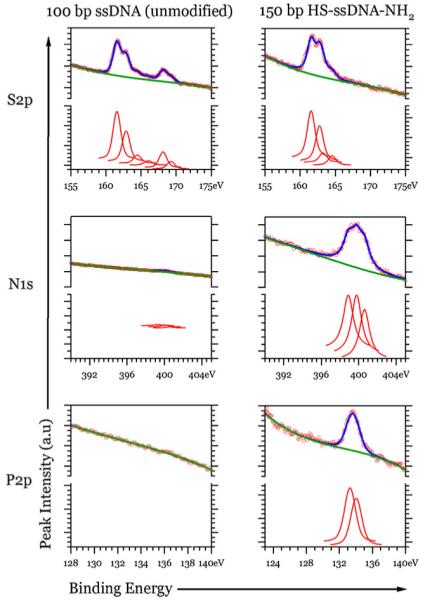
Fig. 8.

S 2p, N 1s, and P 2p XPS spectra of the gold surface reacted with unmodified and modified DNA followed by MHA (circles data, curves fits). Intensity scale in the region of each element is the same for both samples. The nitrogen and phosphorous are observed on the surface with modified DNA and not detectable (traces) for samples exposed to unmodified DNA. Three different species of nitrogen were present on the Au surface with covalently linked DNA. Both samples contained bound (161–163 eV) and unbound (164–165 eV) sulfur, but only the surface treated with 100-mer DNA showed oxidized sulfur (168–169 eV)
