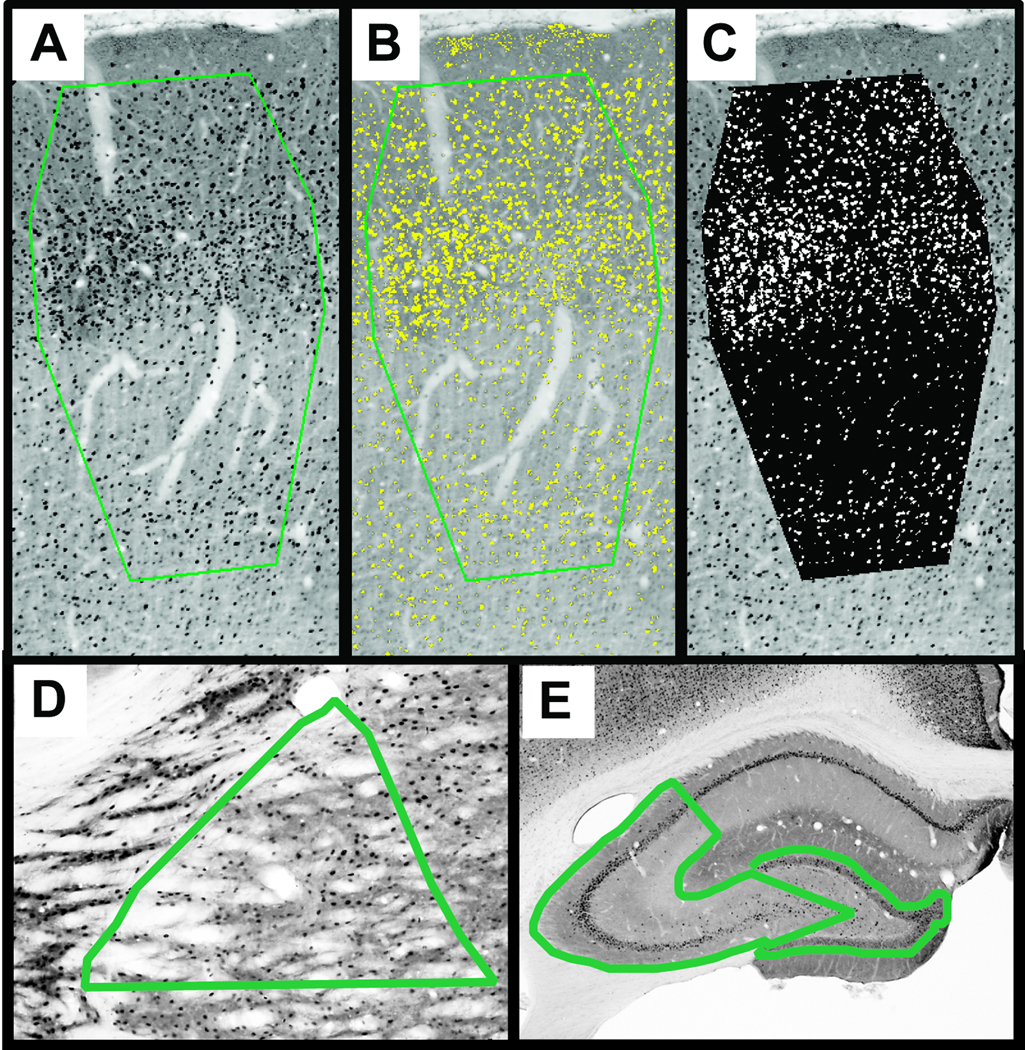
Figure 1.
A digital thresholding procedure was implemented to quantify neuronal activation in the primary somatosensory cortex, ventral posterior thalamus and hippocampus. (A) The region of interest (green border) is outlined to include cortical layers II through V and span the width of the layer IV barrels. Thresholds are adjusted to include immuno-positive staining (B, yellow). Pixels with positive staining are segmented from pixels in unstained tissue (C, white vs. black). The percentage of white pixels to black+white pixels provides the cFos labeling percentage presented in Figure 3. Measurements are replicated three times and averaged to obtain a value for each section. (D) Representative region of interest for the ventral posterior thalamus. (E) Representative regions of interest for hippocampus area CA3 (left) and dentate gyrus (right).

