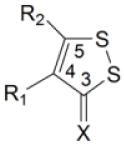
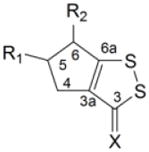
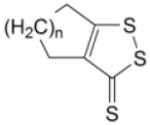
Table 1.
Induction of GST and NQOl by dithiolethiones in rat bladder in vivo
| Relative enzyme activity in the bladder (treated/control) |
||||||
|---|---|---|---|---|---|---|
| Compd | R1 | R2 | X | NQOl | GST | |
 |
1 | H | H | S | 2.78 ± 0.11* | 1.70 ± 0.04* |
| 2 | H | H | O | 1.26 ± 0.09 | 1.01 ± 0.04 | |
| 3 | CH3 | H | S | 1.83 ± 0.12* | 1.23 ± 0.06 | |
| 4 | H | CH3 | S | 1.23 ± 0.06 | 1.08 ± 0.05 | |
| 5 | CH3 | SH | S | 1.29 ± 0.09 | 1.08 ± 0.14 | |
| 6 | C6H5 | SH | S | 1.11 ± 0.07 | 1.03 ± 0.05 | |
| 7 | CO2H | H | S | 3.69 ± 0.30* | 2.11 ± 0.15* | |
| 8 | CO2H | CH3 | S | 1.10 ± 0.04 | 0.99 ± 0.05 | |
| 9 | H | CO2H | S | 1.27 ± 0.10 | 1.11 ± 0.07 | |
| 10 | H | 4-OH-C6H5 | S | 1.02 ± 0.05 | 0.95 ± 0.07 | |
| 11 | CO2CH3 | H | S | 5.05 ± 0.35* | 2.69 ± 0.20* | |
| 12 | CO2C2H5 | H | S | 4.82 ± 0.10* | 2.76 ± 0.11* | |
| 13 | CO2CH3 | CH3 | S | 1.24 ± 0.08 | 1.24 ± 0.08 | |
| 14 | CO2C2H5 | NH2 | S | 2.03 ± 0.23* | 1.25 ± 0.10 | |
| 15 | H | CO2C2H5 | S | 1.13 ± 0.09 | 1.09 ± 0.04 | |
 |
16 | H | H | S | 3.14 ± 0.10* | 1.68 ± 0.05* |
| 17 | H | H | O | 1.24 ± 0.08* | 1.11 ± 0.06 | |
| 18 | H | CO2CH3 | S | 4.39 ± 0.31* | 2.31 ± 0.15* | |
| 19 | H | CO2C2H5 | S | 4.47 ± 0.40* | 2.29 ± 0.19* | |
| 20 | CO2C2H5 | H | S | 1.23 ± 0.04* | 1.11 ± 0.07 | |
| 21 | H | CH3 | S | 1.91 ± 0.16* | 1.30 ± 0.06* | |
| 22 | CH3 | H | S | 1.81 ± 0.07* | 1.31 ± 0.05* | |
 |
23 | n = 2 | 1.46 ± 0.09* | 1.05 ± 0.03 | ||
| 24 | n = 3 | 1.20 ± 0.07 | 1.14 ± 0.05 | |||
| 25 | n = 4 | 1.08 ± 0.06 | 1.11 ± 0.05 | |||
Significantly different from the corresponding control value (P<0.05). Groups of female Sprague-Dawley rats were dosed with vehicle or the test compound by gavage at 7.5 μmol/kg/day for 10 days and sacrificed on the 11th day. Bladders were promptly removed and assayed for enzymatic activities of GST and NQO1. Each value represents the mean ± SEM of results for the 6 animals in each treatment group.
