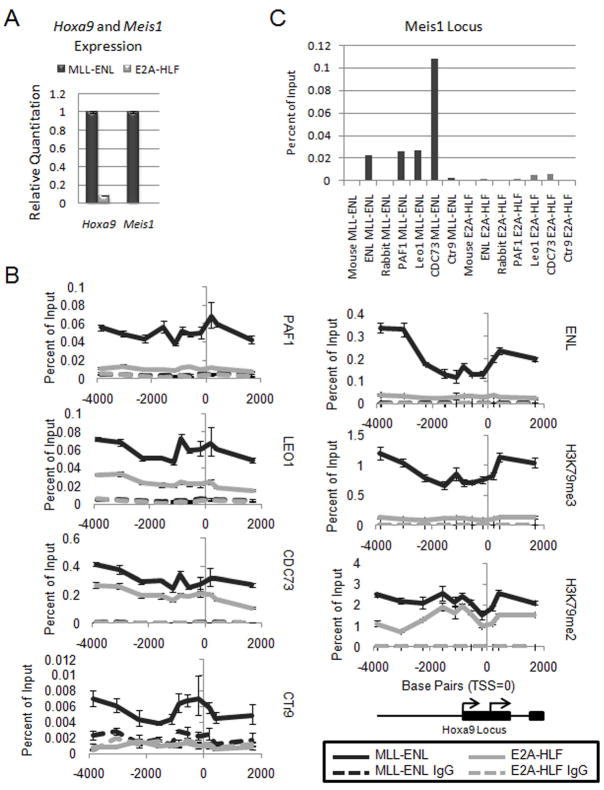
Figure 6. The PAF complex co-localizes with MLL-ENL across the Hoxa9 locus.
A) qPCR for Hoxa9 and Meis1 expression in MLL-ENL and E2A-HLF cell lines. Error bars indicate +/− SD. B) ChIP experiment performed in mouse bone marrow cell lines established with the MLL-ENL or E2A-HLF fusion protein. MLL-ENL IPs are shown in black and H2A-HLF IPs are shown in gray. Solid lines indicate the binding pattern of the component or histone modification listed to the right. The dotted lines indicate control IgG IPs for each cell line. The Hoxa9 locus is shown schematically at the bottom. C) Same experiment as described in B, but binding was determined on the Meis1 locus. The MLL-ENL IPs are shown in black (left) and the E2A-HLF IPs are shown in gray (right). (See also Figure S5)

