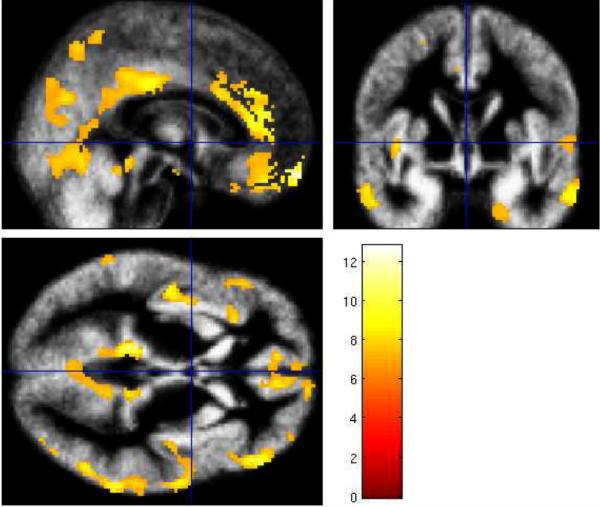
Figure 5.
VBM-detected gray matter volume differences (older < young adults) superimposed on the study-specific normalized mean group image from all subjects and presented in the sagittal, axial and coronal plane (T = 6.68, PFWE corrected = 0.025) (Good et al., 2001). The color bar represents the t scores.

