


Figure 2.
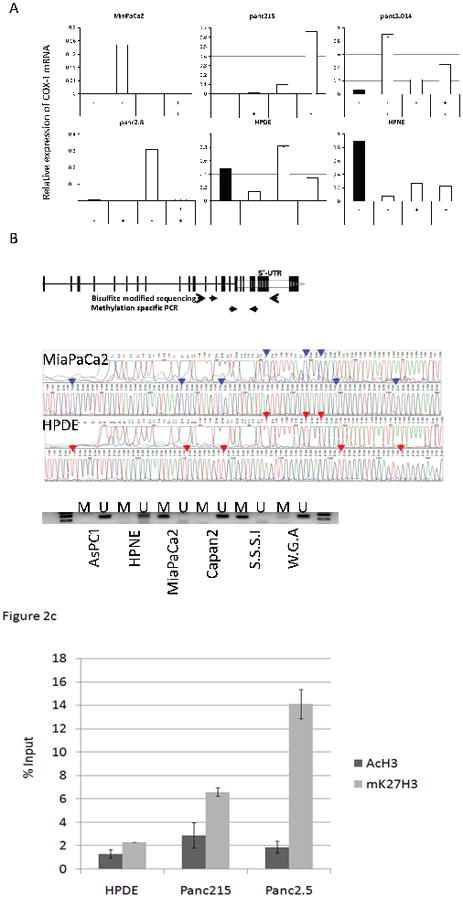
(A) Effect of Epigenetic treatment with 5-aza-dC and/or TSA on pancreatic Cox-1expression. Cox-1 mRNA was measured by qRT-PCR. Ct values were normalized by GAPDH and calibrated by the COX-1 level of BxPC-3. The data is represented as means ± SD (n=3) (B) Primers used in bisulfite sequencing and MSP. A broken arrow represents 5′ untranslated region (UTR) of Cox-1. Vertical lines represent each CpG dinucleotides and black solid arrows indicate primer locations. A representative bisulfite sequencing chromatograph is shown in a middle panel and MSP in the lower panel. After bisulfite treatment methylated cytosines remain unmodified (C) (represented by blue peaks and arrows), but unmethylated cytosines are converted to thymines (T) (red peak and arrow). By MSP, MiaPaCa2 and the S.S.S.I methylase treated DNA are methylated (M) but other samples are unmethylated (U). (C) Quantitative chromatin immunoprecipitation-PCR analysis of the Cox-1 promoter using antibodies to acetylated H3 and mK27H3. Y axis reveals the percentage enrichment of Cox-1 DNA with immunoprecipitation, relative to input DNA.