
Figure 2.
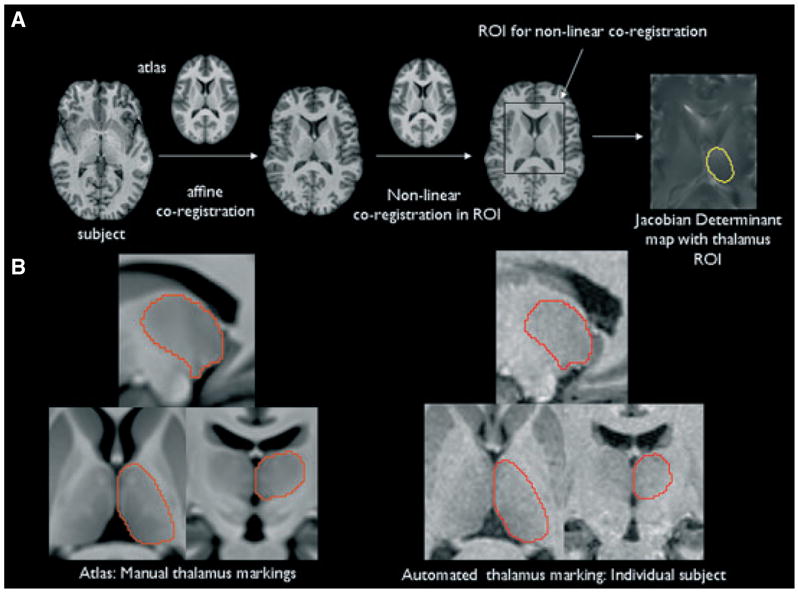
(A) Overview of the generation of the thalamus deformation map. The yellow region in the right-most image indicates the left-sided thalamus label that was used to select the thalamus. (B) Left side: Atlas with manual thalamus tracings. The enhanced contrast of the atlas allows one to distinguish details of the internal structure, including some of the major nuclei of the thalamus. Right side: Automated thalamus tracings in an individual subject. Please refer to the text for details.
Epilepsia © ILAE