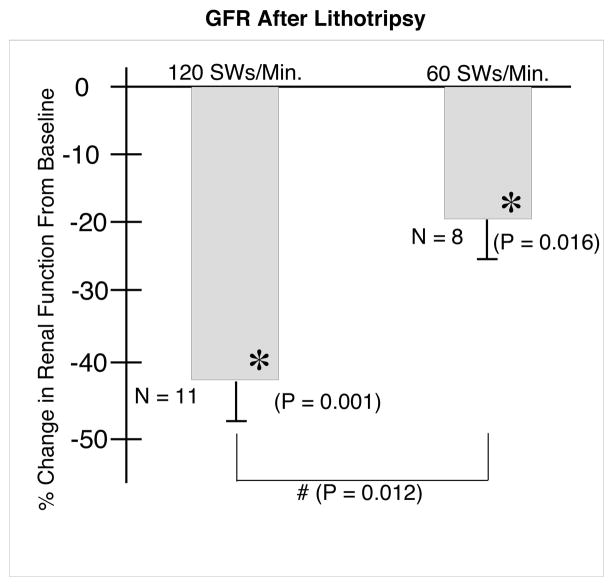
FIG. 3.
Effect of 2000 SWs at 120 or 60 SWs/min on glomerular filtration rate. N indicates the number of animals in each group. The asterisks (*) indicates that renal function after ESWL was significantly different in that group from pre-ESWL baseline values. The Ampersand (#) indicates that the two groups were significantly different 1 hour after ESWL.

