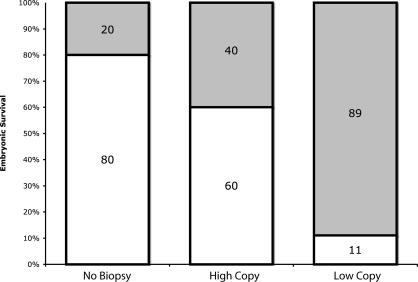
FIG. 4.
Embryo transfer and developmental outcome. Bar graphs represent the mean frequency of implantation and survival, scored by normal morphological and developmental progression following embryo transfer of nonbiopsied controls, Low-copy group embryos (n = 19; mtDNA copy number range, 3558–55 000), and high-copy group embryos (n = 15; mtDNA copy number range, 56 000–160 000). Low-copy and high-copy groups were determined to be statistically different (P > 0.001), but the developmental outcome between the nonbiopsied control embryos and the high-copy group were not (P = 0.52).

