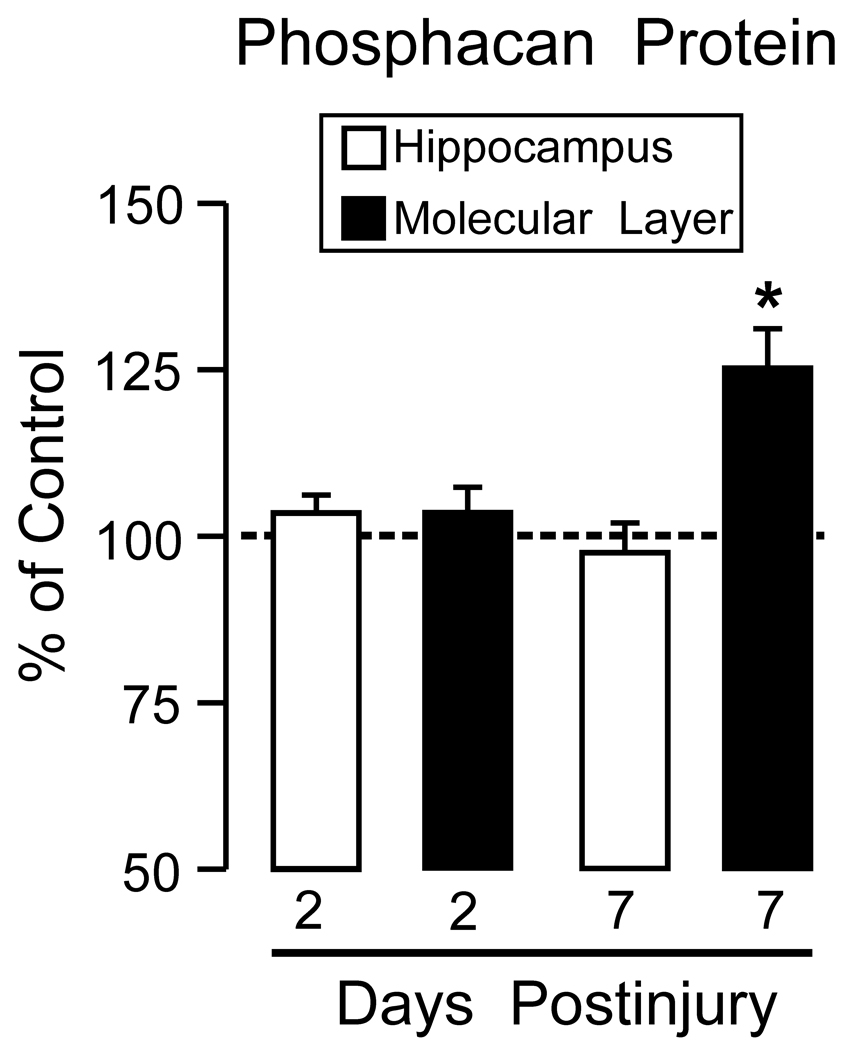
Figure 5. Phosphacan protein expression in the ML enriched samples from dentate gyrus at 2 and 7d following UEC lesion.
Enriched ML extracts are compared with whole hippocampal data (re-plotted from Figure 1). At 2d, when whole hippocampal phosphacan is elevated, ML phosphacan did not change relative to control values. By contrast, the 7d ML enriched fraction showed increased phosphacan, positively correlated with elevation of hippocampal phosphacan transcript at 7d. 2d n=4; 7d n=3; *p<0.02.

