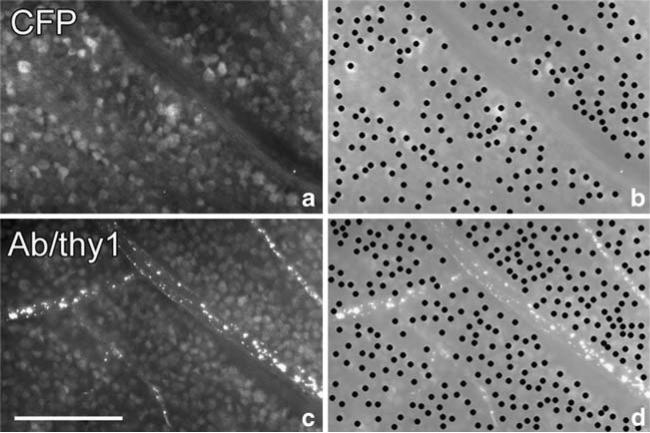
Fig. 3.
Histology of whole-mount retina from a Thy1::CFP mouse. a Shows CFP fluorescence of a fixed normal retina, and c shows THY1 immunofluorescence in the same area. b and d are duplicates of a and b, except that their contrast has been reduced to highlight individual cell bodies that are plotted manually. The number of CFP positive cell bodies in b is 204; the number of THY1-positive cell bodies in d is 281. Bar, 100 μm.

