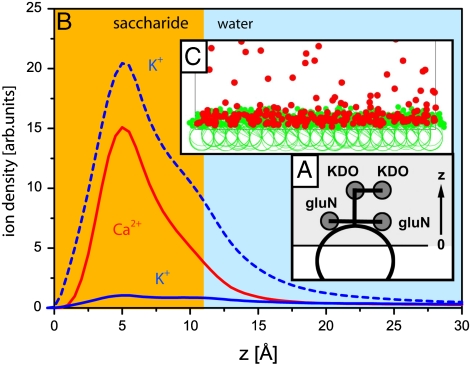
Fig. 4.
MC simulations. (A) Diagram of the LPS Re minimal model. (B) Calculated ion density profiles. Dashed line: K+ ions in Ca2+-free buffer. z = 0 is defined as the chain/carbohydrate interface. Solid lines: Ca2+ and K+ ions in Ca2+-loaded buffer. (C) Simulation snapshot with 50 mM divalent cations (red circles).

