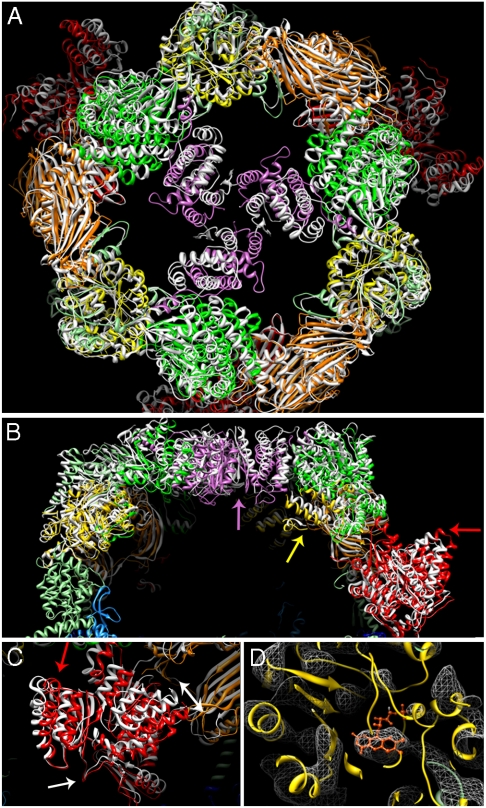
Fig. 2.
Differences between the yeast FAS structure fitted to the EM map and the crystal structure. Fitted domains are colored as in Fig. 1, while the corresponding x-ray structure (2VKZ) is white. (A) Top view of the barrel with the trimerization domain (pink), showing the movement of this domain in the crystal structure with respect to the EM structure. (B) Side view of one dome; arrows indicate the overall movement of domains in the crystal structure relative to the EM map due to compression by crystal contacts at the MPT domain (red arrow). (C) Close-up of the MPT domain seen from the front of the barrel, ∼90° rotated relative to B. The α-hairpin that causes the movement of the MPT domain by ∼10 Å (double-headed arrow) due to crystal contacts is indicated by a red arrow as in B. A white arrow indicates the pivot point at the base of the MPT domain. (D) Clear density is visible for the FMN cofactor (orange) in the ER domain (yellow). The EM map is shown as a white mesh.

