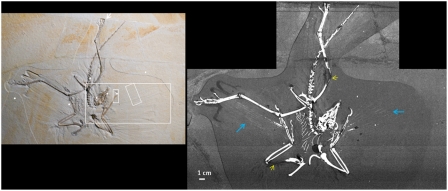
Fig. 1.
SRS-XRF map of the phosphorous distribution in the Thermopolis Archaeopteryx. This map clearly shows the splay of the rachises from the flight feathers (Blue Arrows) and the reconstructed areas (Yellow Arrows). The Inset shows visible light photograph where, although striking feather impressions exist, the rachises are not discernible. The Inset also shows the location of several point analyses (White Dots) and regions highlighted for image analysis (White Rectangles).

