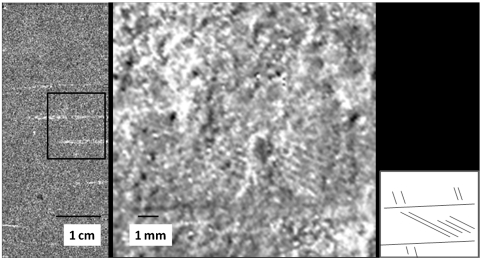
Fig. 5.
Phosphorous and iron in the rachis. At left, a detail of the phosphorous map taken from the rachis area indicated in Fig. 2. The box indicates the region exploded in the right image, which is an Fe map of this area showing the extremely fine barb detail evident at moderate magnification. The small sketch at far right indicates fabric of the barb pattern shown in the Fe map (note that more structure is contained in the image than that shown schematically).

