
FIG. 1.
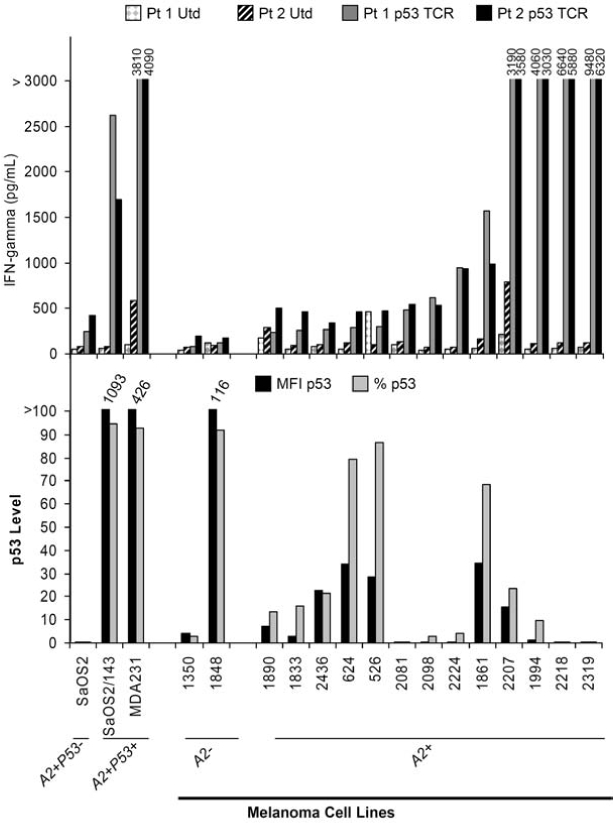
p53 expression by melanoma cell lines and stimulation of p53:264 TCR-transduced T cells. Top: PBLs from two patients (Pt 1 and Pt 2) were stimulated with OKT3 and left untransduced (Utd) or transduced (Td) on two separate days (days 2 and 3) with an MSGV1-based retrovirus encoding the α/β p53264–272 murine TCR (p53 TCR), resulting in a transduction efficiency of 48% (Pt 1 p53 TCR) and 44% (Pt 2 p53 TCR). T cells were expanded for an additional 5 days in vitro before culturing 1 × 10⁵ T cells with 1 × 10⁵ tumor cells overnight. IFN-γ production was determined by ELISA. Bottom: In the same experiment, 1 × 10⁶ tumor cells were assayed for p53 expression by flow cytometry with a PE-labeled mAb specific for mutant and wild-type p53 or isotype control. Both mean fluorescence intensity (MFI p53) and percentage of tumor cells (% p53) expressing p53 are shown (both values are corrected for background staining with the isotype control). SaOS2 (HLA-A2+p53−, osteosarcoma), SaOS2/143 (HLA-A2+p53+, osteosarcoma line transfected with a mutant p53 gene encoding an amino acid change at position 143), MDA-231 (HLA-A2+p53+, breast cancer), and HLA-A2− (1350 and 1848) or HLA-A2− (1890, 1833, 2436, 624, 526, 2081, 2098, 2224, 181, 2207, 1994, 2218, and 2319) melanoma cell lines were assayed.