
FIG. 2.
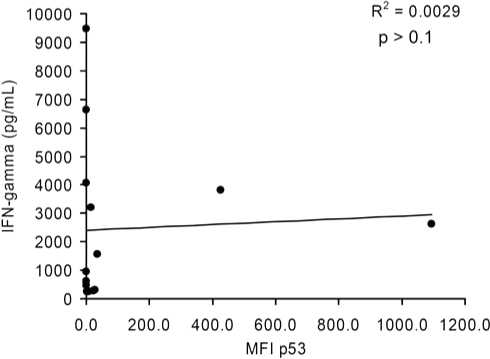
Linear regression analysis of p53 expression in melanoma cell lines and IFN-γ production by cognate T cells. Twelve of the 13 HLA-A2+ melanoma cell lines analyzed in Fig. 1 and Table 1 were included with the 2 HLA-A2+p53+ tumor control lines (SaOS2/143 and MDA-231) in a linear regression analysis investigating the relationship between the specific MFI of p53 and IFN-γ production by cognate effectors from patient 1. Tumor cell line 624 was excluded from this analysis because of the close proximity of the amino acid change to the p53264–272 epitope. This analysis is representative of results obtained with IFN-γ values by p53:264 TCR-transduced T cells from patient 2 (R2 = 0.0013, p > 0.1), and an analysis performed by excluding the outliers MDA-231 and SaOS2/143.