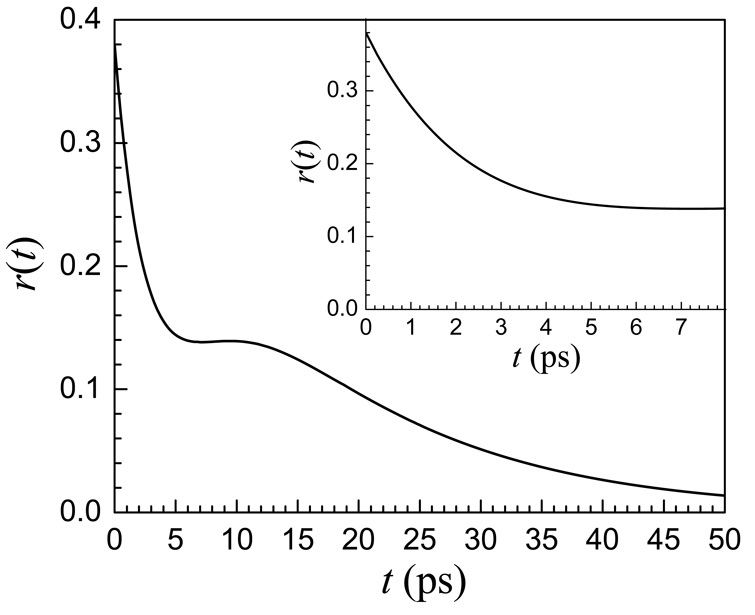
Figure 7.
A calculated curve using the two-subensemble model for anisotropy (equation 5). At long time, r(t) decays to zero. At short time, the curve appears to approach a plateau. The inset is has an expanded time axis and displays the experimentally accessible time range. The inset has the same shape as the 50:1 data displayed in Figure 6.

