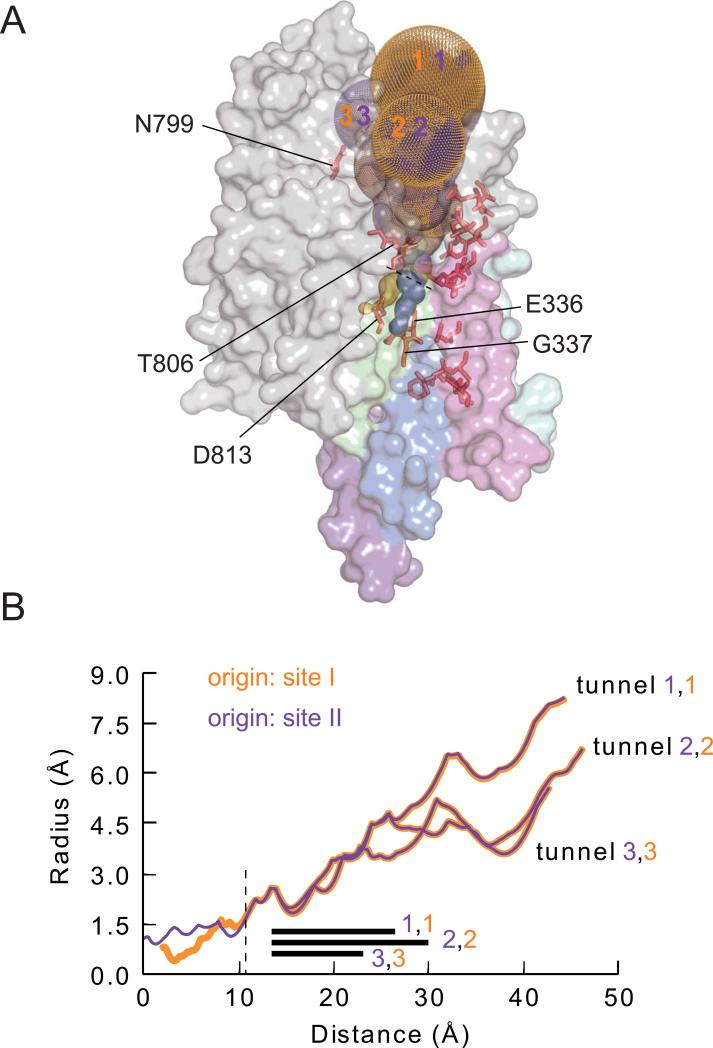
Figure 2.
Characteristics of tunnels in the Na+,K+ pump homology model. (A) Gold and purple dots show tunnels starting from cation-binding sites I and II. Key reactive positions along those tunnels are labeled. Transmembrane helices are colored as in Fig. 1. (B) Radii of tunnels against distance from the level of binding site II. The three tunnels originating from site I are shown as gold lines, and the three from site II as purple lines. The dashed line at ~11Å marks the position of the dashed line in A, after which site I- and site II-originating tunnels superimpose. The black bars indicate the distance over which T806 is associated with the tunnels.

