Figure 4.


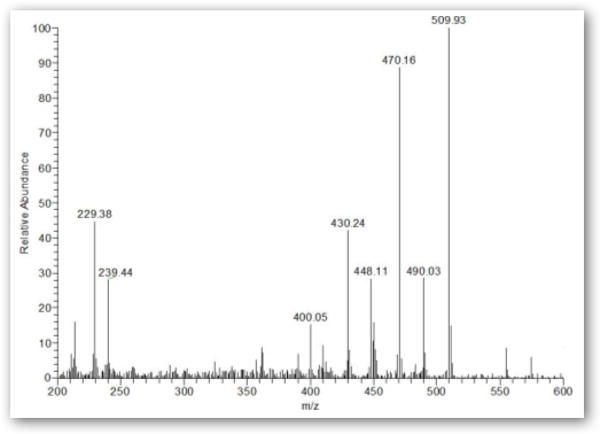
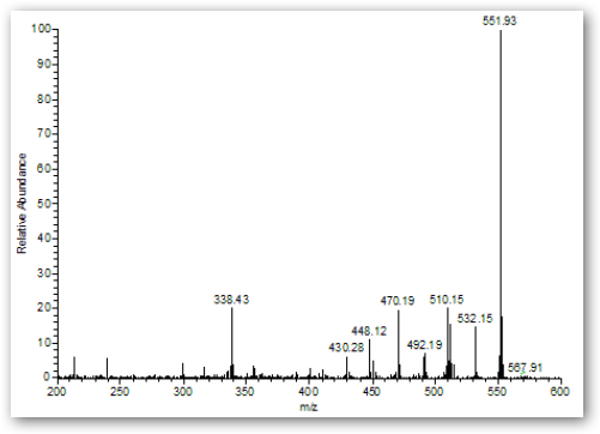
GC mass spectra (m/z 200 – 600) of monoacetyl-HDA (A) and diacetyl-HDA (B) in derivatized extract from untreated control urine sample spiked with 0.9:1 molar ratio (acetic anhydride to HDA or HpDA) mixtures.


GC mass spectra (m/z 200 – 600) of monoacetyl-HDA (A) and diacetyl-HDA (B) in derivatized extract from untreated control urine sample spiked with 0.9:1 molar ratio (acetic anhydride to HDA or HpDA) mixtures.