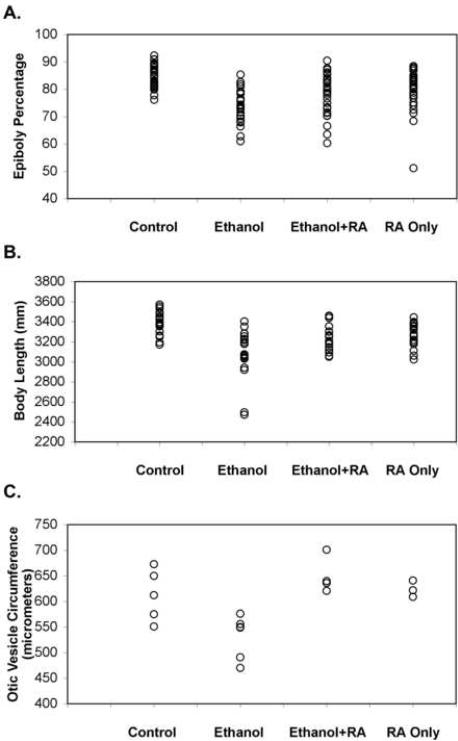
Figure 3.
Scatter plot representation of ethmoid cartilage width variation in embryos treated from 3 hpf until 24 hpf (during gastrulation and somitogenesis) with 100 mM ethanol, 10−9 M retinoic acid, or 100 mM ethanol and 10−9 M retinoic acid together, and compared to untreated control embryos. Ethmoid plate cartilage width was measured in alcian blue stained 4.5 dpf larvae (see Table I for statistical analysis).

