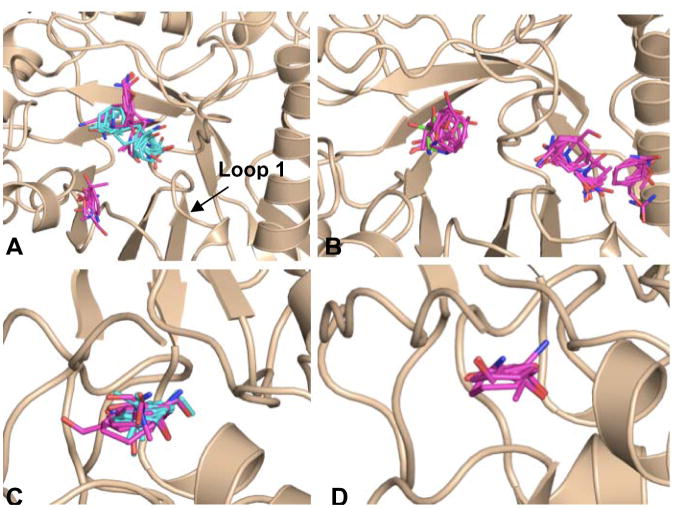
Fig 8.
Close-up view of hot spots formed in the catalytic center (Figure 7A, large circle) and N terminal region (Figure 7A, small circle) of GCase from FTMap simulations (A) Fragment clusters formed in catalytic center of the apo (magenta sticks) and glycerol-bound (cyan sticks) conformations of GCase. (B) Binding of IFG results in a conformational change that allows for the formation of additional hot spots in the active site region (C) The largest number of fragment clusters is found in the N-terminal region of GCase for both the apo (fragment clusters colored in magenta) and glycerol-bound structures of GCase (fragment clusters colored in cyan) (D) Although smaller, a hot spot is also observed in the N-terminal region of the IFM-bound structure (fragment clusters colored in magenta).

