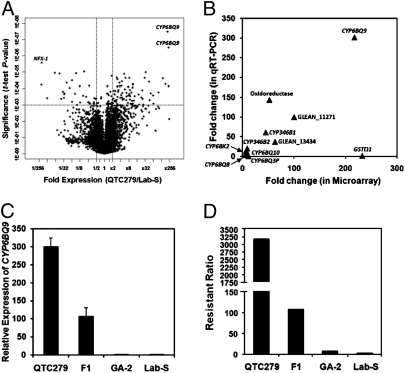
Fig. 1.
Differential expression of T. castaneum genes. (A) The V plot of differentially expressed genes identified by microarray analysis. The P values of t test were plotted against fold suppression or overexpression. The horizontal bar in the plot shows the nominal significant level 0.001 for the t test under the assumption that each gene had a unique variance. The vertical bars separate the genes that are a minimum of 2.0-fold difference in the QTC279 strain when compared with their levels in the Lab-S strain. Three independent samples each containing 10 adult QTC279 or Lab-S beetles were analyzed. The genes identified by the Bonferroni multiple-testing correction are shown. (B) Correlation between microarray data and qRT-PCR data of genes selected from the list shown in Table S2. Both microarray and qRT-PCR data showed similar fold changes for most genes with only two exceptions, GSTΩ and CYP6BQ3P. The genes were labeled with gene names for those with identified gene products, and the rest of them were labeled with Glean numbers. (C) Relative expression of CYP6BQ9 in QTC279, F1 (offspring of QTC279 male and Lab-S female), GA-2, and Lab-S strain. The data shown are the mean + SEM (n = 4). (D) The resistant ratio of deltamethrin in QTC279, F1 (offspring of QTC279 male and Lab-S female), GA-2, and Lab-S strains. The resistance ratios were calculated by comparing LC50 values obtained with QTC279, F1 (offspring of QTC279 male and Lab-S female), and GA-2 with the LC50 obtained with Lab-S strain.

