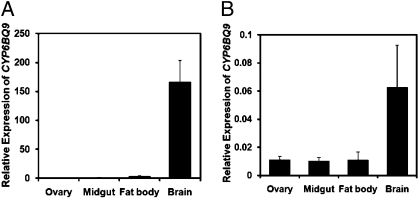
Fig. 3.
Tissue-specific expression of CYP6BQ9. Relative expression levels of CYP6BQ9 in the ovary, midgut, fat body, and brain of the QTC279 (A) and Lab-S (B) strains. Tissues were dissected and total RNAs were isolated to quantify CYP6BQ9 mRNA levels by qRT-PCR as described in Materials and Methods. Relative expression levels were normalized by the expression of rp49. The data shown are mean + SEM (n = 9).

