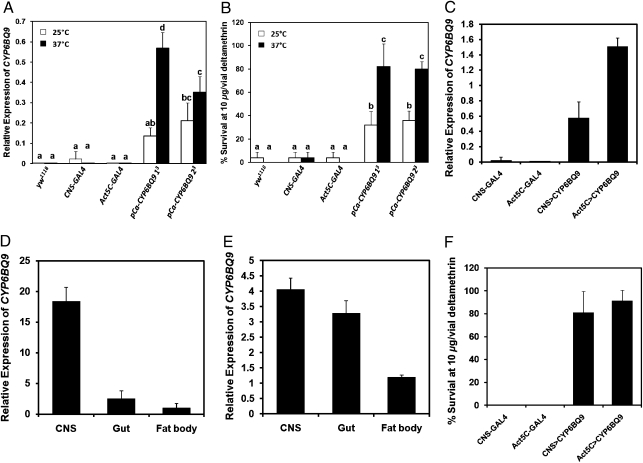
Fig. 4.
The expression of T. castaneum CYP6BQ9 and its effect on deltamethrin resistance in D. melanogaster. (A) The mRNA levels of CYP6BQ9 were quantified by qRT-PCR in three control nontransgenic strains (yw1118, CNS-GAL4, and Act5C-GAL4) and two different transgenic fly lines (pCa-CYP6BQ9 13 and pCa-CYP6BQ9 23; both of them showed CYP6BQ9 insertion in the third chromosome). The expression levels of CYP6BQ9 in both transformed lines were enhanced by heat shock. The data shown are the mean + SEM (n = 4). (B) The percent survival of three control nontransgenic strains and two different transgenic fly lines exposed to 10 μg deltamethrin/vial at 25 °C and 37 °C. The data shown are mean + SEM (n = 5). The data (A and B) were analyzed by ANOVA, followed by Bonferroni multiple mean separation techniques at P < 0.05 (SAS v9.0 software; SAS Institute Inc.). There is no significant difference in the level of expression among samples marked with the same letter. (C) The relative expression of CYP6BQ9 in two control strains (CNS-GAL4 and Act5C-GAL4) and two transgenic lines (CNS > CYP6BQ9 and Act5C > CYP6BQ9) are shown. The data shown are mean + SEM (n = 4). (D and E) Tissue-specific expression of CYP6BQ9 in CNS > CYP6BQ9 and Act5C > CYP6BQ9 strains, respectively. Relative expression levels were normalized using rp49 expression as a control. The data shown are mean + SEM (n = 4). (F) The percent survival of two control strains and two transgenic lines exposed to 10 μg deltamethrin/vial. The data shown are mean + SEM (n = 8).

