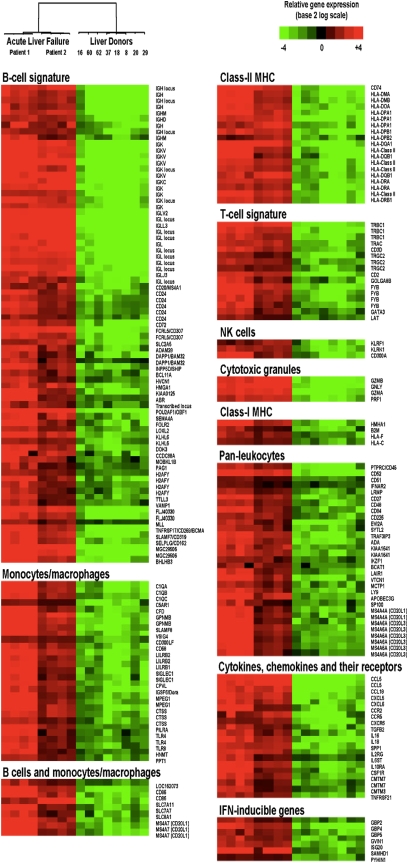
Fig. 2.
Supervised hierarchical cluster analysis showing the differential expression of immune response-related transcripts in HBV-associated ALF and control liver donors. Each row represents data for a particular human transcript, and each column the expression of transcripts in a single liver specimen. The color in each cell reflects the level of expression of the corresponding transcript in the corresponding sample, relative to its mean level of expression in the entire set of 16 samples. Mean-centered ratios of transcript expression are depicted by a log2-transformed scale. According to the color scale, up-regulated transcripts are shown in shades of red and down-regulated transcripts in shades of green.

