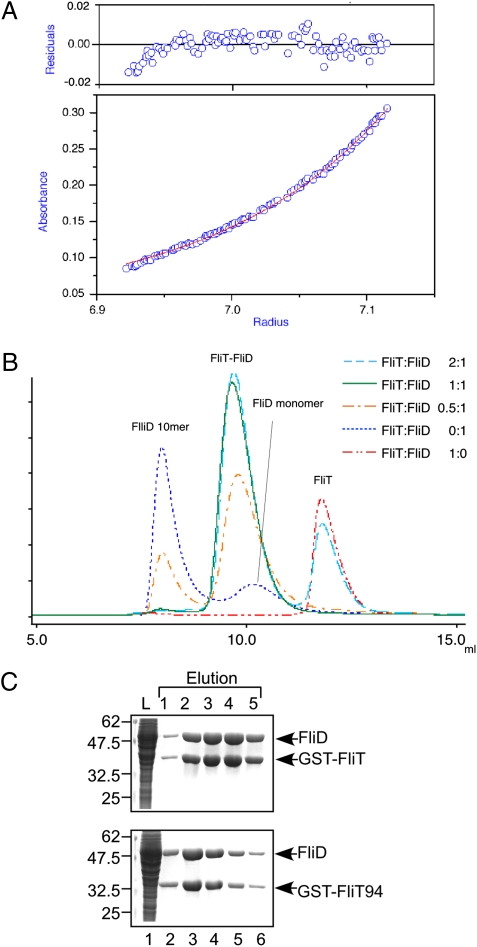
Fig. 3.
Heterodimer formation of FliT and FliD in solution. (A) Sedimentation equilibrium measurement of the FliT–FliD complex. (Lower) Sedimentation equilibrium profile (initial absorbance of 0.2 at 280 nm, measured at 12,000 rpm). Open circles are data points, and the continuous red line is a model fit curve for a single molecular species with a molecular mass of 62.0 kDa, which corresponds well to the molecular mass of a FliT–FliD heterodimer (63.4 kDa). (Upper) Plots of the residuals of each data point from the fitting curve. (B) Elution profiles of mixtures of FliT and FliD at various FliT:FliD molar ratios: 2:1 (cyan dashed line), 1:1 (green solid line), 0.5:1 (orange dotted-dashed line), 0:1 (blue dotted line), and 1:0 (red two-dotted–dashed line). (C) Pull-down assay by GST affinity chromatography. Soluble fractions (L) prepared from a ΔflhDC-cheW mutant expressing GST-FliT or GST-FliT94 were mixed with those from the ΔflhDC-cheW mutant producing FliD and loaded onto the GST affinity column. After extensive washing, proteins were eluted with a buffer containing 10 mM reduced glutathione. The eluted fractions were analyzed by CBB staining.

