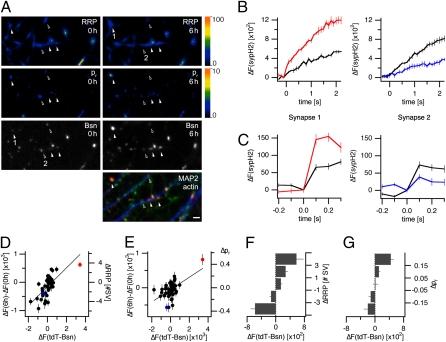
Fig. 4.
Changes in active zone size lead to corresponding alterations in RRP size and pr. Neurons transfected with sypH2 and tdT-Bsn were used in a time lapse experiment to identify synapses at which pr, RRP, and/or active zone cytomatrix sizes changed over the course of 6 h. Cells were then fixed and stained with anti-MAP2 antibodies and Cy5-conjugated phalloidin to visualize dendritic tubulin (blue) and actin (green), respectively, allowing the identification of axodendritic synapses. Only active zone cytomatrices within 1 μm of a MAP2-positive dendritic shaft that were colocalized with a phalloidin-visualized spine were included in the subsequent analysis. (A) Responses to train stimulation (RRP) and average responses to isolated stimuli at 0.2 Hz (pr) and tdT-Bassoon fluorescence (Bsn) at several synapses at the beginning of the experiment (Left) and after 6 h (Right). Filled or open arrowheads denote synapses at which tdT-Bsn fluorescence as well as RRP and pr measures increase or decrease, respectively. (Bottom Right) The same field after visualization of actin and MAP2 (MAP2/actin). (Scale bar, 4 μm.) (B) At the synapses denoted with 1 and 2 in (A), sypH2 responses stimulus trains increased or decreased significantly (P < 0.001) in parallel with changes in tdT-Bsn fluorescence (P < 10−4 and P < 0.01, E). (C) At the same synapses, a significant enhancement or attenuation, respectively, in the averaged response to isolated stimuli at 0.2 Hz was observed (P < 0.001). (D) Correlation between changes in the sypH2 response to stimulus trains delivered at the onset of the experiment (ΔF1) and after 6 h (ΔF2), and changes in tdT-Bsn fluorescence for 45 synapses in this experiment (r = 0.697, P < 10−6, Pearson product moment correlation). Synapses 1 and 2 are highlighted in red and blue, respectively. (E) Correlation between changes in the average sypH2 response to isolated stimuli delivered at the onset (ΔF1) and end of the experiment (ΔF2), respectively, and changes in tdT-Bsn fluorescence (r = 0.544, P < 0.001). sypH2 fluorescence changes were converted into estimates of changes in RRP or pr as outlined in the legend to Fig. 2. (F) Changes in tdT-Bassoon fluorescence that occurred at a total of 122 synapses in three experiments that were binned according to the change in RRP size occurring during a 5- to 6-h experiment. (G) Changes in tdT-Bassoon fluorescence at the same 122 synapses, binned for changes in pr.

