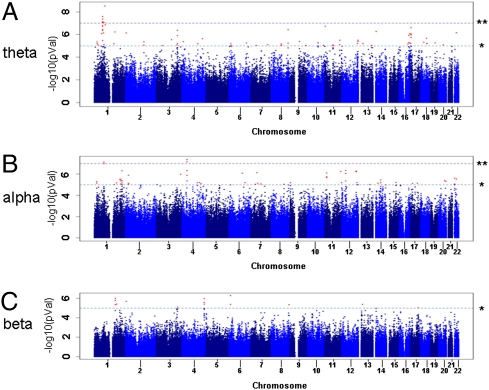
Fig. 1.
Manhattan plots for resting EEG spectral power: θ (A), α (B), and β (C). The three plots show association (−log10P value) (y axis) for individual SNPs (uncorrected for family structure) against chromosome position (x axis). Threshold P values of 1 × 10⁻⁷ (**) and 1 × 10⁻⁵ (*) are indicated by dotted lines.

