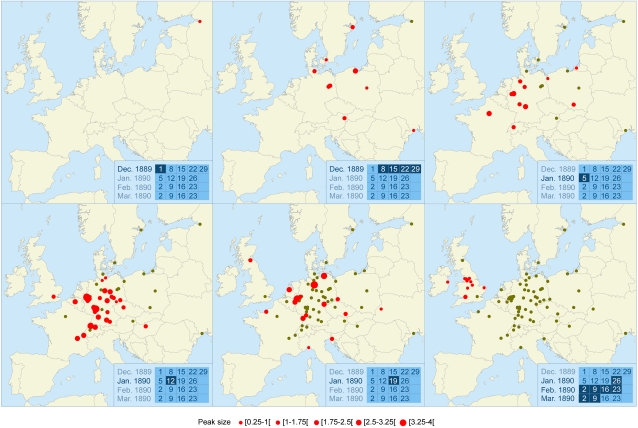
Fig. 1.
Spread of the 1889 pandemic throughout continental Europe (2006 boundaries) during six successive periods. Each panel refers to a period of one or several weeks shown on the calendar in the Inset. Red dots indicate the places of the mortality peaks that occurred during this period and are proportional to peak size. Green dots indicate cities after the mortality peak has passed. The whole set of European cities studied can be visualized in the last panel (68 in continental Europe and 14 in the United Kingdom and Ireland). Movie S1 shows the week-by-week spread in Europe and in the United States.

