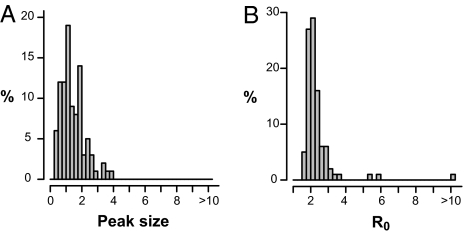
Fig. 2.
Distributions of 1889 pandemic mortality peaks and R0 values. (A) Peak sizes for 96 cities worldwide. The peak size for each city is the relative mortality increase at the peak's highest amplitude compared with baseline mortality; e.g., a peak size of 3 indicates that the excess mortality at the peak was three times the baseline mortality. (B) Estimates of R0 values, assuming CFR = 0.2%, and respective Weibull distributed latent and infectious periods with means of 1.6 and 1.0 days.

