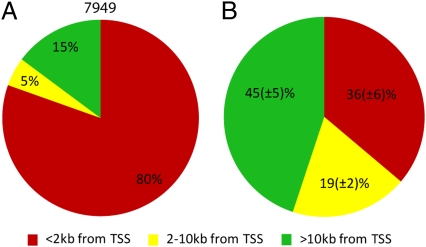
Fig. 5.
Numbers and distribution of H3K4me3 peaks in PFC neurons. (A) Distribution of 7,949 peaks common to all 11 subjects in relation to annotated TSSs (<2 kb, 2–10 kb, > 10 kb as indicated) (B) Same as in A but for subject specific peaks. Numbers are expressed as mean ± SEM with n = 11. Notice different distribution patterns of “common,” in A, and “subject specific” peaks, in B.

