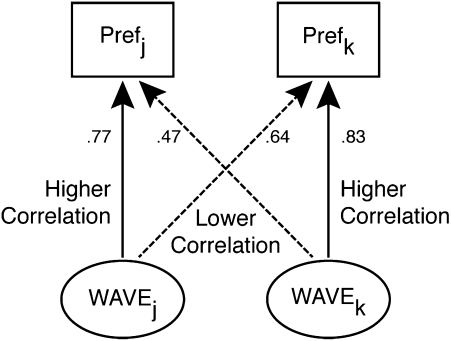
Fig. 2.
Diagram showing a central tenet of the EVT: The correlation between WAVEs and color preferences obtained within a group should be stronger than the correlation between WAVEs and color preferences obtained from different groups. The correlations are obtained from individuals with similar color preferences as determined by hierarchical clustering (21). (Fig. S1 shows plots of the color preferences and WAVEs of these two groups.)

