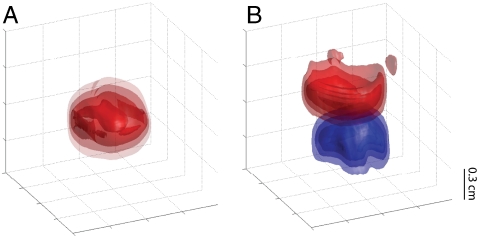
Fig. 3.
Three-dimensional images of the saturation effect at Vcurrent = 500 μV. In A, the single-loop phantom is imaged with τsl = 50 ms and νcurrent = 100 Hz. In the double-loop phantom of B, current (τsl = 160 ms) is applied simultaneously in each loop at different frequencies, while the spin-lock power is switched between resonance conditions to selectively image only one loop. The top loop (red) has νcurrent = 100 Hz, while the bottom loop (blue) has νcurrent = 250 Hz. Contours are shown at 30%, 50%, 70%, and 90% saturation with respect to controls.

