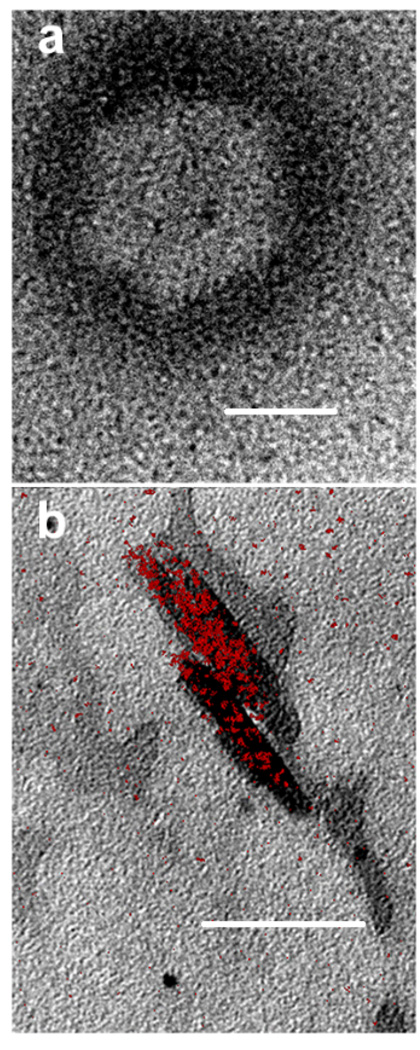
Fig. 2.
TEM showing haem localization at or near the lipid-water interface. When haematin was premixed with MPG and introduced onto an aqueous surface and immediately imaged using TEM, electron dense material, presumably haematin, was localized at or near the lipid-water interface (a). Elemental imaging of iron using TEM with electron spectroscopic imaging (ESI) conducted on samples reacted for 10 min. confirmed the presence of β-haematin crystals (b). Regions highlighted in red denote the presence of Fe. Scale bar = 50 nm.

