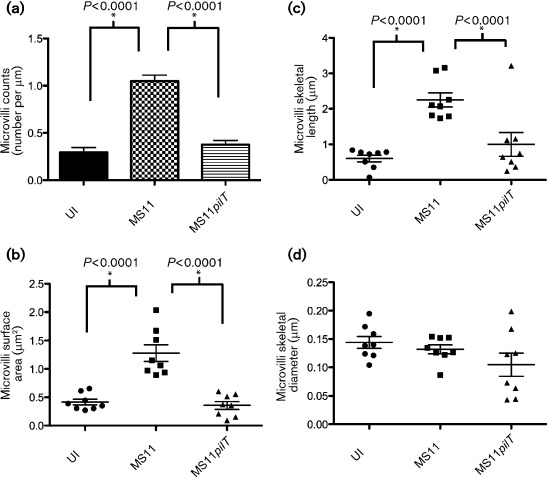
Fig. 3.
Quantification of microvillus architecture of N. gonorrhoeae-infected cells. A431 cells were mock-infected with medium (UI) or infected with wt MS11 or MS11pilT for 3 h, then prepared for TEM. Random fields from each infection condition were scored for various microvilli parameters (see Methods). (a) Microvilli counts were determined by scoring 10 thin-section (70 nm) images of each sample. Values are expressed as the number of microvilli per micrometre of plasma membrane. Values are means from the 10 images with error bars representing sem. Scatter plots of (b) microvilli surface area, (c) microvilli skeletal length and (d) microvilli skeletal diameter were calculated for each infection condition from two independent 3D datasets. Successive thin-section images of each sample set were scored for each of these attributes as described in Methods. Mean values in each scatter plot are represented by the wide horizontal bars; sem values are indicated by the error bars. P values of paired samples are shown (asterisks).

