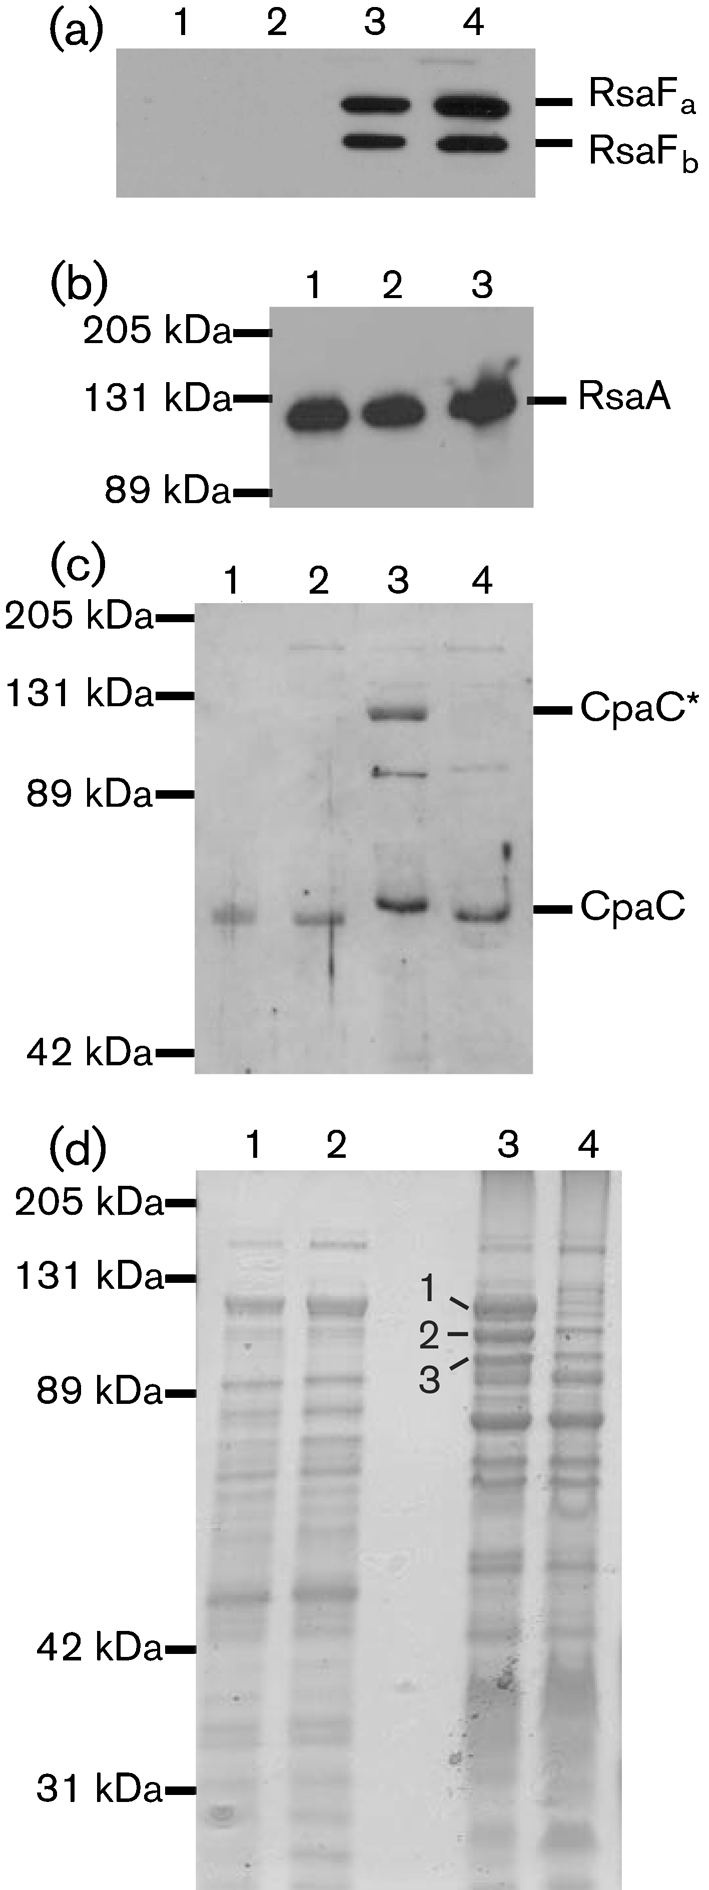
Fig. 5.

Levels of CpaC* and of three abundant membrane proteins are reduced in ΔbamE membranes. (a, c, d) Equal amounts of soluble and membrane proteins were analysed by SDS-PAGE. Lanes: 1, CB15N/pMR10 soluble; 2, ΔbamE/pMR10 soluble; 3, CB15N/pMR10 membrane; 4, ΔbamE/pMR10 membrane. RsaFa and RsaFb (a) and CpaC and CpaC* (c) were detected by Western blotting; proteins were visualized by GelCode Blue staining (d), and three indicated protein bands (1–3) were excised for trypsin digestion and analysis by mass spectrometry. (b) Surface-exposed RsaA was extracted from CB15N/pMR10 (lane 1), ΔbamE/pMR10 (2) and ΔbamE/pbamE (3) and detected by SDS-PAGE and Western blotting.
