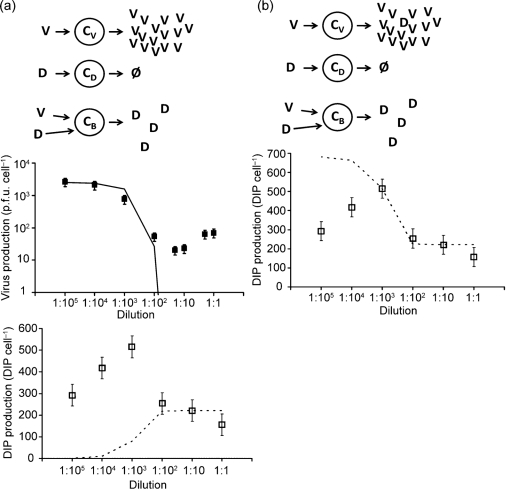
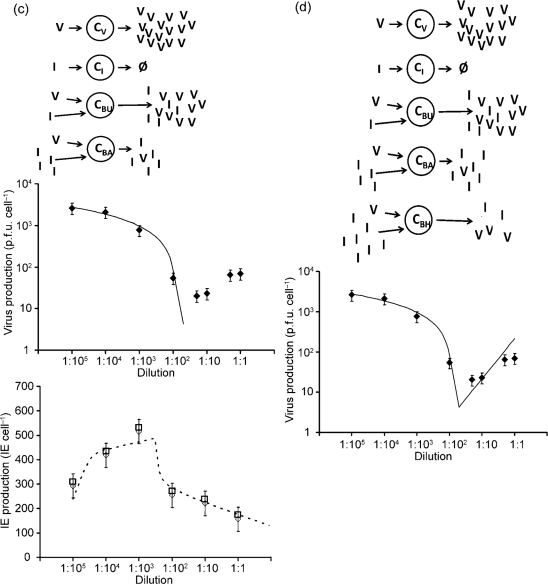
Fig. 2.
Models of virus and DIP production. (a) Model 1: co-infected cells amplify DIPs. Upper panel: virus-infected cell (CV) produces only virus (V), cell infected by DIP (CD) produces nothing, cell co-infected with DIP and virus (CB) produces only DIPs (D). Middle panel: effect of added DIPs on virus production; data (points) vs model (solid line). Lower panel: effect of added DIPs on DIP production; data (points) vs model (dashed line). Estimated parameters are bV (2500), bB (20) and dB (220). (b) Model 2: virus-infected cells generate DIPs. Upper panel: virus-infected cell (CV) produces virus (V) and generates new DIPs (D), cell infected by DIP (CD) produces nothing, cell co-infected with DIP and virus (CB) produces only DIPs. Lower panel: effect of added DIPs on DIP production; data (points) vs model (dashed line). Parameters are bV (2500), bB (20), dB (222) and g (680). (c) Model 3: higher DIP multiplicities cause more interference. Upper panel: virus-infected cell (CV) produces only virus, cell infected by interfering units (CI) produces nothing, cell co-infected with low IE and virus (CBU) produces both V and IEs with minimal interference, and cell co-infected with high IE and virus (CBA) produces IEs at the expense of virus production. Middle panel: effect of added IEs on virus production; data (points) vs model (solid line). Lower panel: effect of added IEs on IE production; data (points) vs model (dashed line). Parameters are b (2670), d (420), z (180), p (−880), w (290), r (30) and s (−80). (d) Model 4: IEs fail to shut down virus production completely. Upper panel: model 4 extends model 3 to account for co-infected cells with very high levels of IEs and virus (CBH), allowing for production of virus at the expense of IEs. Lower panel: effect of added IEs on virus production; data (points) vs model (solid line). Parameters are b (2670), d (420), z (180), p (−880), w (290), r (30), s (−80) and q (0.47).


