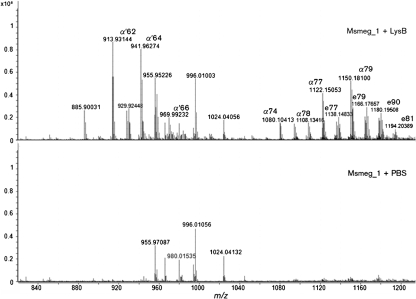
Fig. 5.
LC-MS (negative mode) identification of mycolic acids from released Msmeg_1 after LysB treatment (top panel). The bottom panel is a control with no LysB treatment. The mycolates, thus identified, were consistent with the more detailed analysis of TDM shown in Fig. 3. α, α-mycolates; α′, α′-mycolates; e, epoxy mycolates. The ion at m/z 980 is from the calibration standard; the ions at m/z 955, 996 and 1024 (found in both the control and the sample) are of unknown origin, and can also be seen in Fig. 1.

