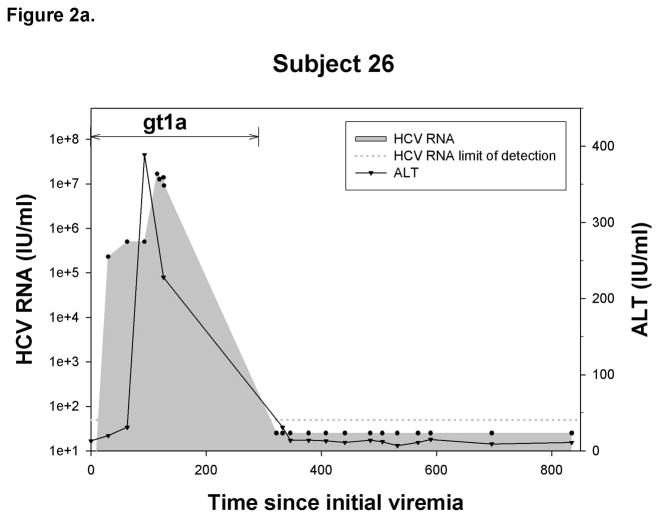
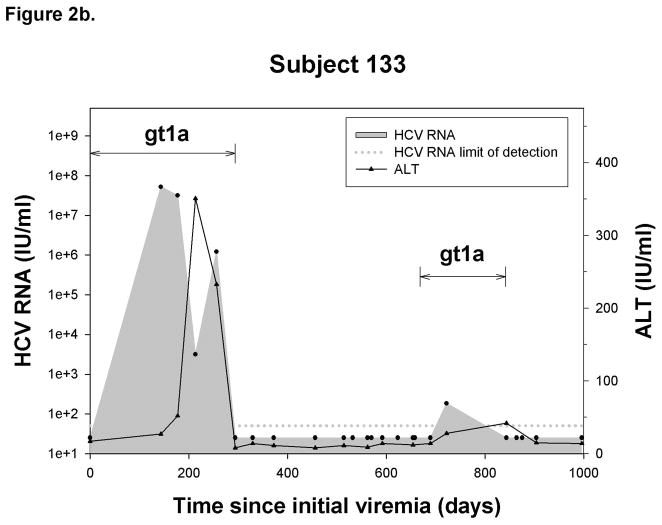
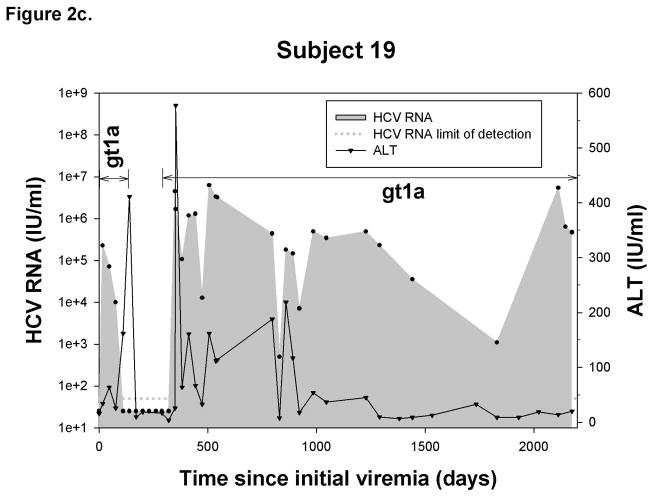
Figure 2.
Representative graphs demonstrating the history of viremia and plasma ALT levels in A) No reinfection, B) Reinfection-cleared and C) Reinfection-persistent groups. HCV genotype of primary infection and reinfection is indicated and the time over which a unique virus is detected is denoted by a horizontal black line. Black circles represent HCV RNA concentrations (IU/ml) detected in serum or plasma samples obtained at given time points from date of first detection of viremia. Dotted-line denotes the HCV RNA limit of detection. Samples below the HCV RNA limit of detection were assigned a value of 25 IU/ml. Black triangles denote ALT activity (IU/ml) detected in plasma samples obtained at given time points from date of first detection of viremia.


