FIGURE 3.
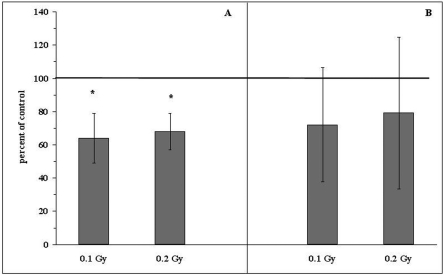
Relative numbers (percentages of the control values indicated as solid line at 100%) of the induced tumor colonies in the lungs of BALB/c mice exposed to single (A) or fractionated (B) total doses of 0.1 or 0.2 Gy X-rays and two hours later i.v. injected with L1 sarcoma cells. Mean values ± SD (bars) are shown. *indicates statistically significant (p<0.05) difference from the control (100%) value.

