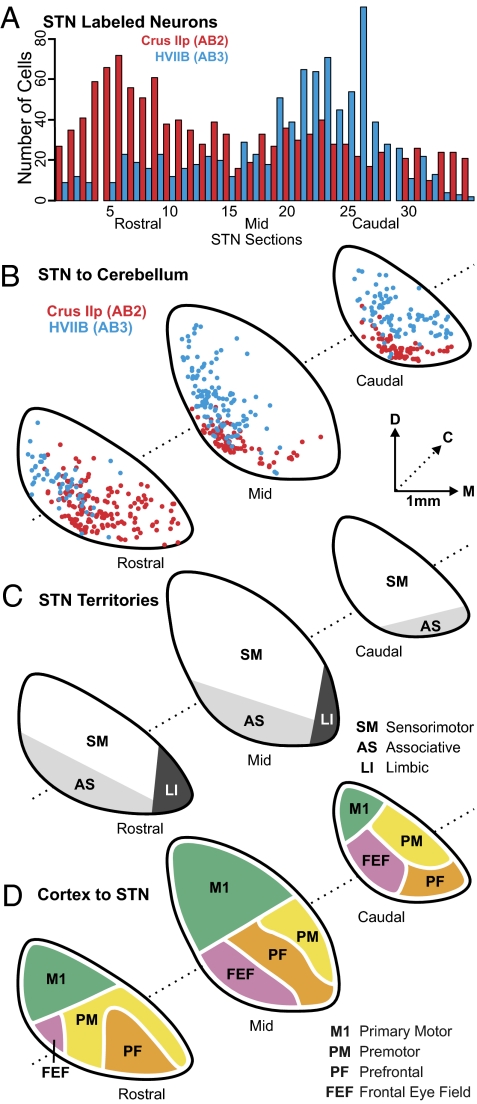
Fig. 4.
Topography of STN projections to the cerebellar hemisphere. (A) Histogram of the rostrocaudal distribution of second-order neurons in STN in AB2 (red bars) and AB3 (blue bars). The distance between two consecutive sections represented is 100 μm. Missing bars correspond to missing sections. (B) Charts of labeled neurons in AB2 (red dots) and AB3 (blue dots) are overlapped to illustrate the topographic differences in distribution of second-order neurons in STN of the two cases. (C) Schematic representation of STN organization, according to the tripartite functional subdivision of the basal ganglia (adapted from ref. 16). (D) Schematic summary of the known connections of the STN with areas of the cerebral cortex (based on refs. 31–36). C, caudal; D, dorsal; M, medial.

