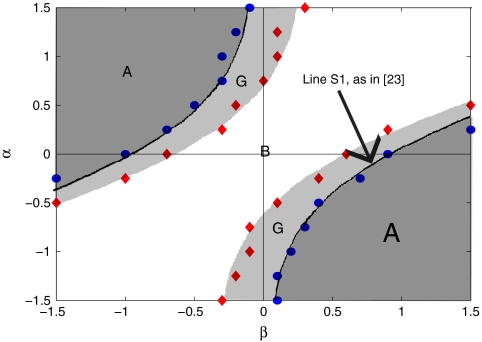
Fig. 5.
Identification of the transition curves in the parameter space. The line S1 is the Eckhaus limit described in ref. 23. The red squares correspond to the values of β for which the transition B–G or G–B occurs. The blue circles are the values of β for which the transitions G–A and A–G occur. Notice that the symmetric line in the region β < 0 is also well reconstructed.

