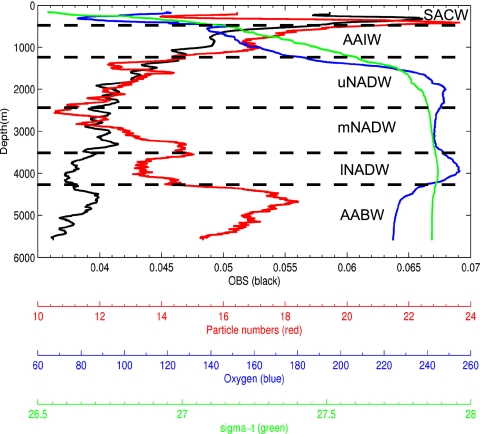
Fig. 2.
Example of a deep-sea profile of sigma-t, oxygen (μmol/kg), relative particle numbers per frame from video observations (video; 100-m moving average), and optical backscatter (obs; 100-m moving average). Optical backscatter decreases with depth and remains low. In contrast, defined particle peaks in the macroscopic particle profile were present in the deep sea. Watermasses: SACW, South Atlantic Central Water; AAIW, Antarctic Intermediate Water; uNADW, upper North Atlantic Deep Water; mNADW, middle North Atlantic Deep Water; lNADW, lower North Atlantic Deep Water; AABW, Antarctic Bottom Water. The upper mixed layer is not shown.

