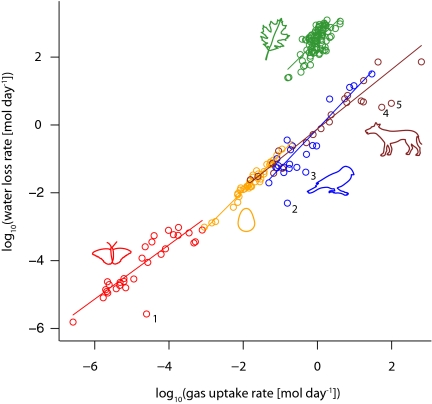
Fig. 1.
Scaling of water loss to gas exchange—O2 for animals and CO2 for plants (n = 202). Solid lines represent lines from a fitted linear model that allowed interactions between group (plants, mammals, etc.) and log10(gas uptake rate). The labeled points are outliers that were not included in the formal modeling. They are Blatella germanica (German cockroach; 1), Bolborhynchus lineola (lineolated parakeet; 2), Falco mexicanus (prairie falcon; 3), Tursiops truncatus (bottlenose dolphin; 4), and Delphinapterus leucas (beluga whale; 5).

