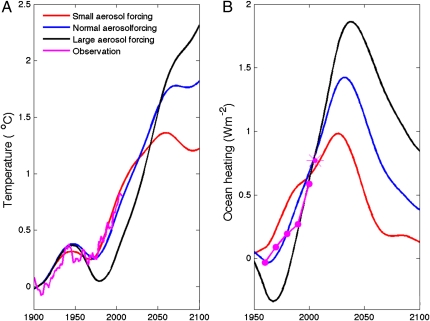
Fig. 4.
(A) Simulated temperature increases under three aerosol forcing cases (−0.5 Wm−2, −1.4 Wm−2, and −1.8 Wm−2). The aerosol forcing is the sum of the energy addition by BC and the masking by SON_Mix. The uncertainty range shown here is consistent with published summaries (13). Climate sensitivity in each run is adjusted to mimic the 20th century warming trend and/or the ocean heating. Observation is from the Goddard Institute for Space Studies dataset. (B) Ocean heating, which is the time rate of change of ocean heat content. Observed values for 1960–2000 are from Levitus et al. (16), and observed values for 2003–2008 are from Schuckmann et al. (62).

