


FIG. 2.
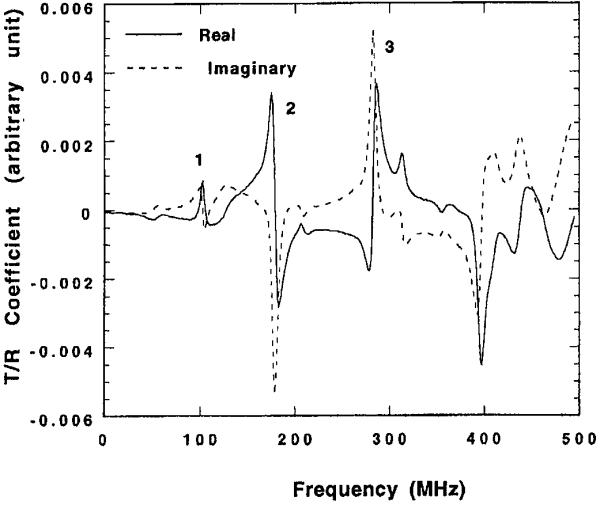
The dielectric resonant spectrum of a cylindrical water body, measured with two small shielded loops. The two loops were placed on the opposite sides of the water body, and the transmission coefficient between them was measured and plotted here. The first three resonances labeled 1, 2, 3 were imaged on a 4 T scanner to visualize their magnetic field distributions.